Metrics that measure what your team actually set out to do
Intent-based DORA metrics. SPACE developer experience surveys. Strategic alignment tools. One platform, built with Rust.
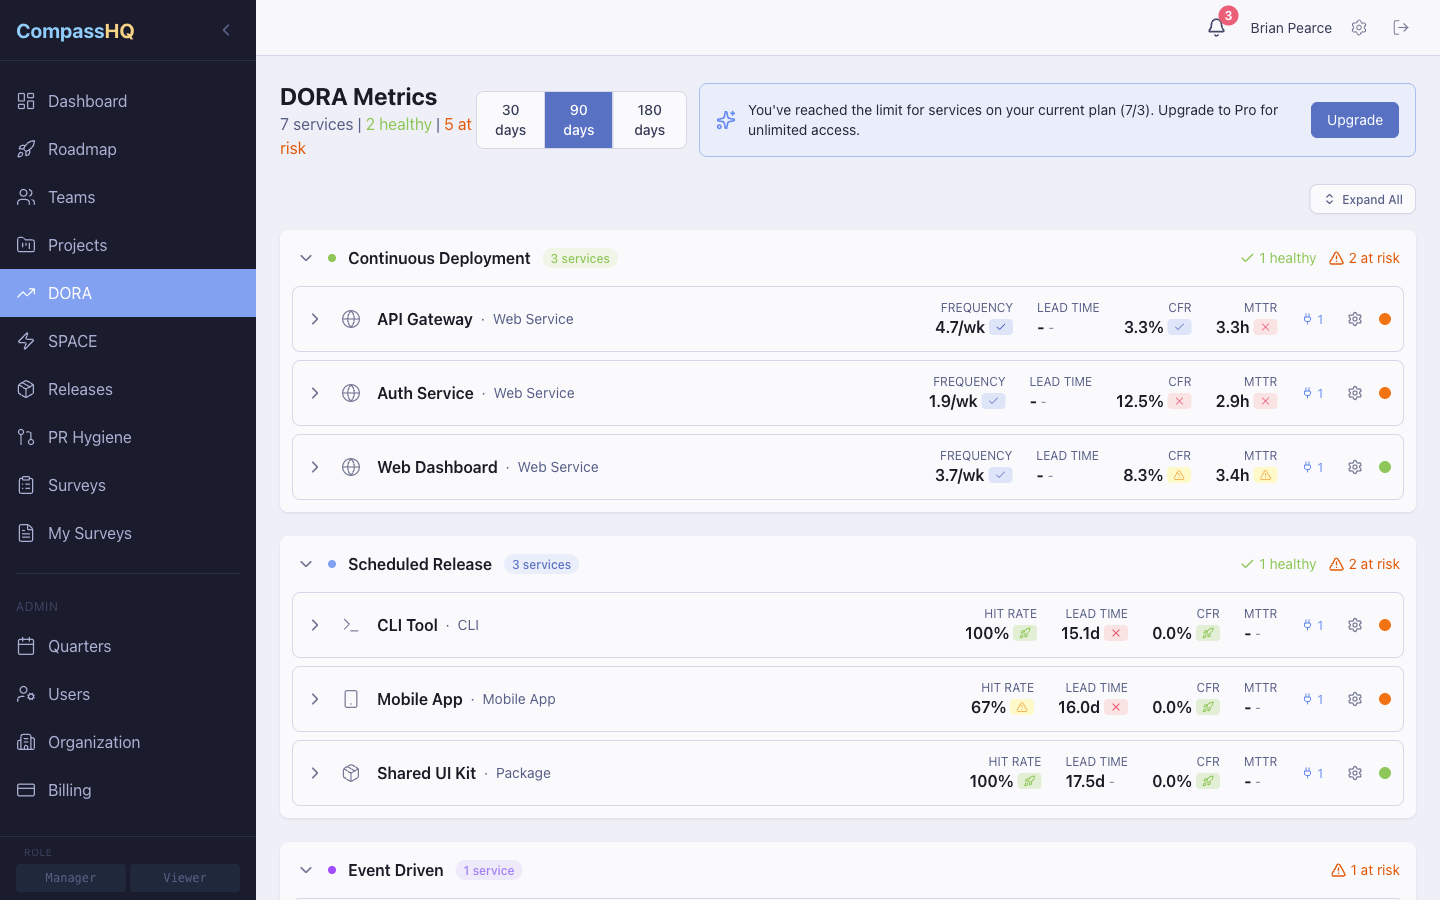
Intent-based delivery metrics
Stop comparing your team to industry averages. CompassHQ measures your team's delivery against its own stated intent.
- Supports CD, scheduled release, and event-driven delivery models
- Four core metrics: deployment frequency, lead time, change failure rate, MTTR
- Release hit rate tracking for scheduled teams
- Performance badges: Exceeding, OnTrack, AtRisk, Missing
- Portfolio view grouped by delivery model
- Per-service delivery profile evaluation
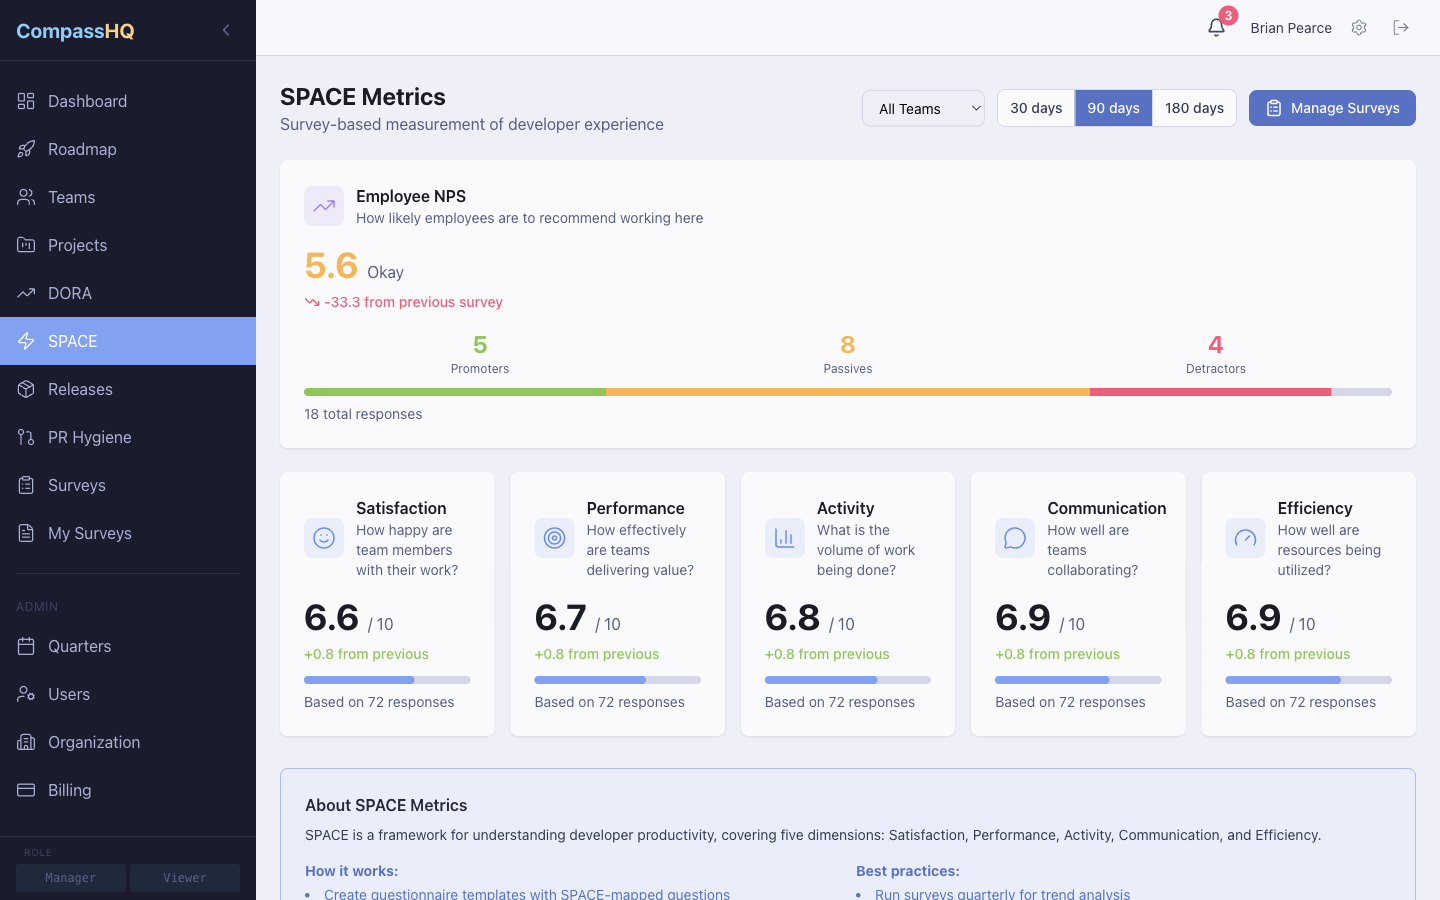
Measure developer experience, not just output
The SPACE framework captures what metrics alone can't: developer satisfaction, collaboration quality, and perceived efficiency.
- Five SPACE categories tracked via configurable surveys
- Question types: rating scale, multiple choice, free text
- Survey campaigns with org, team, or project targeting
- Anonymity levels: anonymous and identified
- Survey distribution with configurable reminders
- eNPS calculation and trending over time
- Week-over-week delta tracking on SPACE scores
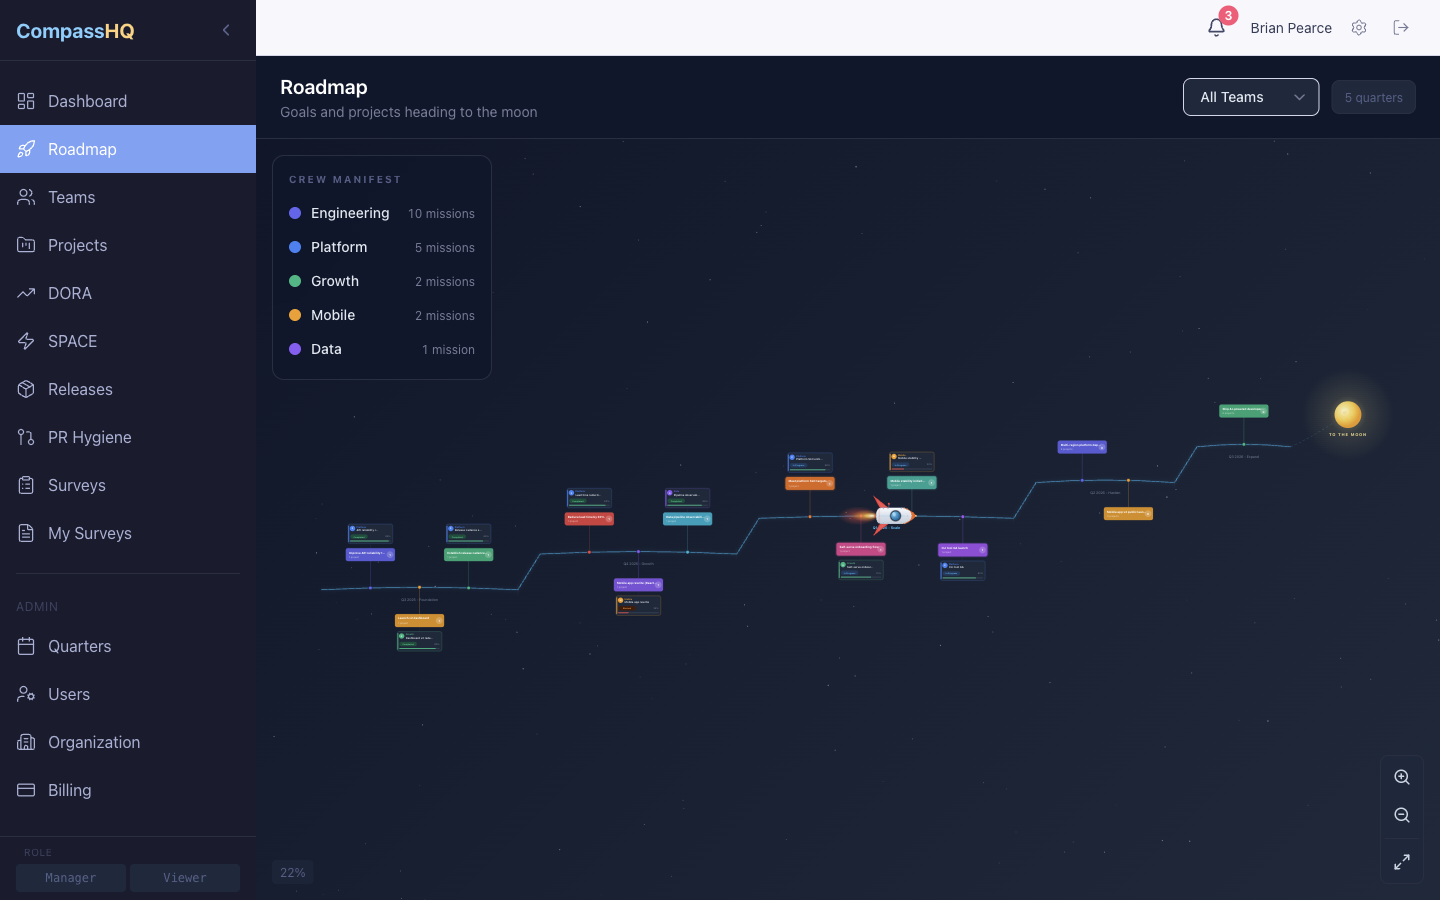
Connect engineering execution to business goals
See at a glance whether your team's work aligns with company objectives through visual strategy maps and roadmaps.
- Quarterly goal setting with progress tracking
- Strategy Map: visual node graph connecting goals to projects to teams
- North Star Roadmap: multi-quarter trajectory visualization
- Project management with status, confidence, and team assignment
- Team management with role-based access
- Filtered views by team for focused analysis
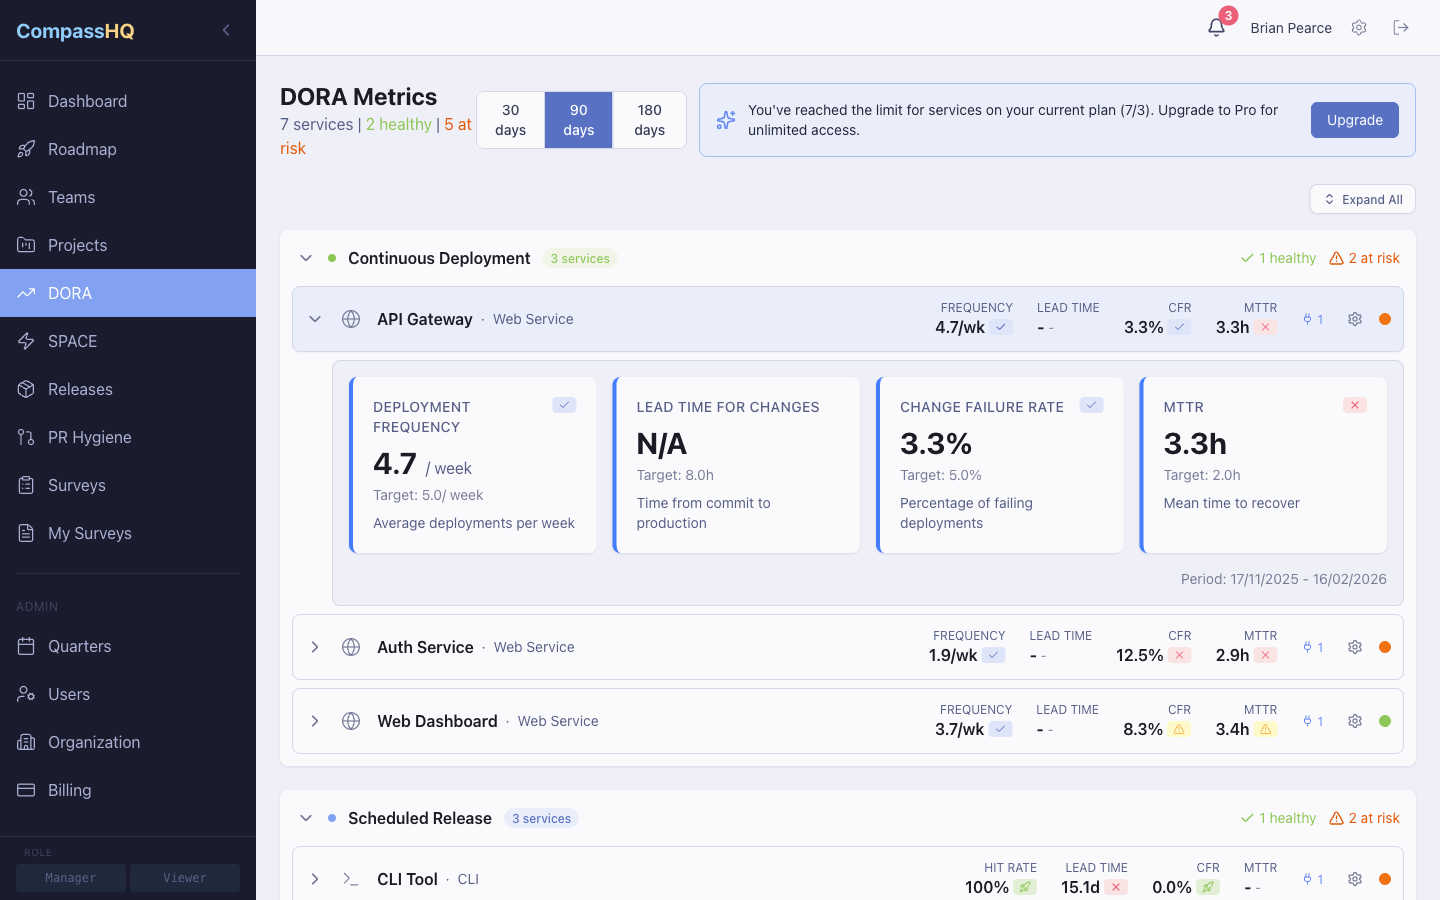
Define and track your services
- Per-service delivery profiles (CD, scheduled, event-driven)
- Configurable metric targets per service
- GitHub integration per service
- Deployment and incident tracking
- PR sync and hygiene metrics per service
Automated data from your existing workflow
PR Hygiene
Review times, cycle times, and bottlenecks from GitHub
Deployments
Manual, webhook, and GitHub sync tracking
Incidents
Automated detection and failure mode tracking
Releases
Schedule adherence and on-time delivery rates
Serious about security
Multi-tenant isolation
Organization-level data separation
Role-based access
Admin, Manager, and Contributor roles
API key auth
CI/CD integration via secure API keys
Google OAuth SSO
Single sign-on for your entire team
Encryption
TLS encryption in transit, HSTS enforced
Built with Rust
Performance and memory safety guaranteed
Start your free beta trial
Full access to every feature. No credit card required.